• • •
"Mike and Jon, Jon and Mike—I've known them both for years, and, clearly, one of them is very funny. As for the other: truly one of the great hangers-on of our time."—Steve Bodow, head writer, The Daily Show
•
"Who can really judge what's funny? If humor is a subjective medium, then can there be something that is really and truly hilarious? Me. This book."—Daniel Handler, author, Adverbs, and personal representative of Lemony Snicket
•
"The good news: I thought Our Kampf was consistently hilarious. The bad news: I’m the guy who wrote Monkeybone."—Sam Hamm, screenwriter, Batman, Batman Returns, and Homecoming
March 18, 2010
All Is For the Best
By: Seth Ackerman
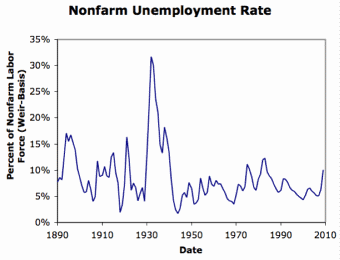
Yesterday, Brad DeLong posted this graph without comment:

I guess in the grand scheme of things, unemployment right now isn’t all that bad.
Except that - hey, what’s with the legend along the left side of the graph? “Percent of non-farm labor force”? Don’t we usually talk about the unemployment rate as a percentage of the total civilian labor force, not the non-farm labor force? (Yes, we do.)
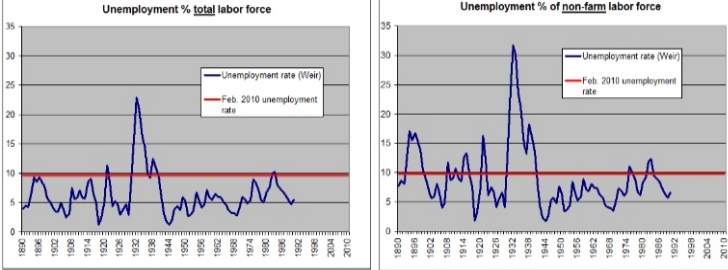
Fortunately, the economic historian David Weir, the source of Brad’s data, produced unemployment estimates using both definitions. Even more fortunately, they’re conveniently available via Cambridge’s Historical Statistics of the United States, which you need a subscription to, via a fancy university such as Stutts .
The graphs below show Weir’s unemployment rates reported both ways. Weir originally published his data only up through 1990, so I’ve added in a horizontal bar showing today’s current unemployment rate of about 9.7%:

Yup. Pretty bad. Pretty world-historically bad.
So, how should we construe these two different unemployment definitions? What’s the difference? Well, a hundred years ago agriculture accounted for a much bigger portion of the labor force – about a third. So not only was a large segment of the population relatively sheltered from the labor market, and thus immune from unemployment, but if you did get thrown out of work, you might be able to return to the old homestead and make ends meet there for a while. Nowadays, you probably can’t. The magic of the market is all we have.
As helpfully explained in the interpretive essay on unemployment data included in Historical Statistics of the United States:
Unemployment is the condition of someone who is willing and able to work but who cannot find employment. For the self-employed, there is always something to do, even in slow times. Unemployment, therefore, presupposes a class of workers who are dependent on wage or salary earnings for their livelihood. Even as late as 1900, only about two thirds of the labor force were wage and salary workers.
The essay goes on to reference Alexander Keyssar’s pioneering study of the early history of American unemployment:
Early production of manufactured products took place within an agricultural setting in which any reduction in industrial employment could be offset by reallocating labor into some alternative sphere. The appearance of modern unemployment, in [Keyssar’s] story, required the abandonment of agriculture for full-time industrial work.
So there you have it. Sorry for being so long-winded to make a fairly straightforward point. I just didn’t want to see Brad’s graph become the basis for some Frankenstein talking point.
—Seth Ackerman
Jon,
Do you know if these graphs are using the same definition of unemployment at all times? The current unemployment rate understates unemployment, as it excludes discouraged workers who stopped looking, marginally attached workers, and those working part time involuntarily.
These definitions were changed in 1994. The rate listed in your chart is the U3, I believe. This did not exist prior to 1994, as a separate category.
Do the past rates listed give unemployment based on what it would have been by the U3 criteria? In other words, is it consistent, or do the past unemployment levels include discouraged workers? If past rates did include those categories, then current unemployment is even worse by historical standards. I have no idea if this is the case or not.
(I notice the graph doesn't run past 1994)
Posted by: Graeme at March 18, 2010 01:38 PMOops, sorry. That should have been addressed to Seth.
Posted by: Graeme at March 18, 2010 06:03 PMYes, the two lower graphs are using a consistent definition of unemployment at all times - the U3 definition - from 1890 to 1990. The reason the data stop at 1990 is that Weir only constructed them in 1992. We've always had solid data for the post-1948 period from the BLS. What Weir was trying to do was extend those data back to 1890 on a consistent, comparable basis.
The BLS redesigned its survey of households, the source of unemployment data, in 1994. They never changed the definition of unemployment, but they did change their sampling methodology and question wording. As they always do when undertaking a redesign, the BLS conducted research to measure the effect of the changes on the resulting data. You can read all the gruesome details here: http://www.bls.gov/ore/pdf/ec950090.pdf . The upshot: "The new methodology
did not have a significant effect on the overall unemployment rate."
You're right that the U3 definition omits discouraged, marginally attached, and involuntary part-time workers, but I wouldn't say it "understates" unemployment. It measures exactly what it's supposed to measure. If you want to know what the unemployment rate is if those categories of workers are included rather than excluded, all you have to do is look at the U6 measure of unemployment, which the BLS publishes every month in the same press release that reports the U-3 rate.
Posted by: Seth at March 18, 2010 07:11 PMThanks! I was mistaken, for some reason I thought the pre-1994 rate included the discouraged.
I would still say it understates them to the extent that discouraged workers feel like they're unemployed, particularly since most people don't know about U4-6.
Though you're right, it measures what it measures just fine. And I'm not sure that it's the BLS's fault that the media doesn't often mention the other U rates.
Posted by: Graeme at March 18, 2010 07:50 PMI just love that definition of unemployment in the Historical Statistics of the US: "For the self-employed person, there is always something to do, even in slow times." As a self-employed person, I find relief in knowing that I can never be unemployed, like those salaried people; I can clean my house, or walk the dog, or any number of things, and laugh all the way to the bank.
Posted by: Cisco at March 19, 2010 10:24 AMSeth,
I thought that the trigger for being declared "discouraged", and thus excluded from U3, had become more "generous" over time, thus causing something of a shrinkage of U3 vs U6 over time.
Posted by: shargash at March 23, 2010 10:25 AMShargash -
No, I don't think so. I think the opposite sort of happened. The 1994 redesign reclassified a lot of discouraged workers as non-discouraged marginally attached workers. (In other words, it required respondents to give more concrete evidence of having once really looked for work but then given up out of hopelessness in order to be classified as discouraged.) I guess this reduced measured U-5 but not U-6? But I'm too lazy to look this up right now.
But, again, the redesign had essentially no effect on the U-3 unemployment rate in either direction.
I would say this as a general matter: If the BLS did something that had the effect of lowering the published official unemployment rate, *everyone would know about it*.
Posted by: Seth at March 23, 2010 09:33 PM


