• • •
"Mike and Jon, Jon and Mike—I've known them both for years, and, clearly, one of them is very funny. As for the other: truly one of the great hangers-on of our time."—Steve Bodow, head writer, The Daily Show
•
"Who can really judge what's funny? If humor is a subjective medium, then can there be something that is really and truly hilarious? Me. This book."—Daniel Handler, author, Adverbs, and personal representative of Lemony Snicket
•
"The good news: I thought Our Kampf was consistently hilarious. The bad news: I’m the guy who wrote Monkeybone."—Sam Hamm, screenwriter, Batman, Batman Returns, and Homecoming
April 18, 2011
Tax Day Graphs
If I were teaching a class of smart 7th graders how to lie with statistics, I'd use the Heritage Foundation's Budget Chart Book. It includes everything you'd need in your toolbox if you wanted to bamboozle people in this particular way, yet it's simple enough that a 12-year-old could understand how they do it.
For instance, here's one of their charts:
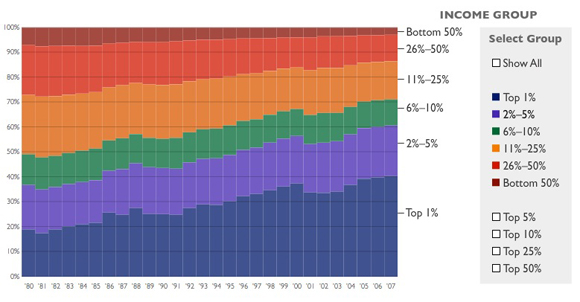
The Top 10 Percent of Income Earners Paid 71 Percent of Federal Income TaxTop earners are the target for new tax increases, but the U.S. tax system is already highly progressive. The top 1 percent of income earners paid 40 percent of all federal income taxes in 2007, while the bottom 50 percent paid only 3 percent. More than one-third of U.S. earners paid no federal income tax at all.

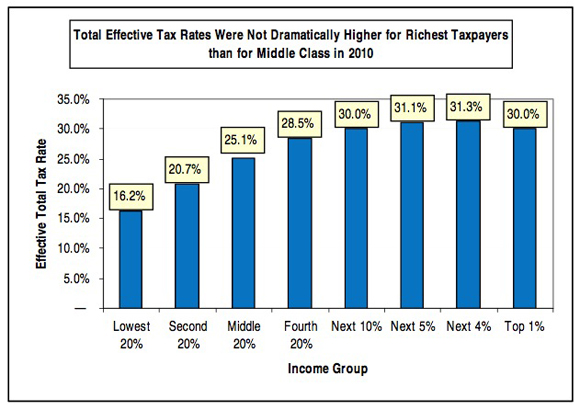
The most important deception here is the phrase "U.S. tax system."* The federal income tax is, in fact, progressive. But it's by no means the entire U.S. tax system. There are also federal payroll taxes (regressive) and state taxes on income (generally flat), property taxes (generally flat) and sales (regressive). When all of that is added together, the system as a whole is only slightly progressive, and in fact is essentially flat from the middle quintile upwards. Here's a useful chart from Citizens for Tax Justice which includes all taxes:

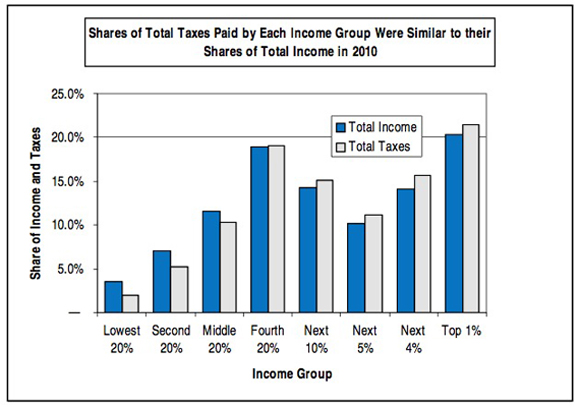
* For extra credit, I'd have the smart 7th graders explain a less crucial but still important deception: whether there's any necessary connection between the (accurate) statistics Heritage gives about how much of the total federal income tax is paid by the top 1% and bottom 50%, and their statement in the previous sentence that taxes are "highly progressive." Obviously there isn't: we could have a flat tax, but if the top 1% earned 40% of all income, then they'd pay 40% of all income taxes. And if the bottom 3% only earned 3% of all income, then they'd pay 3% of all income taxes. Heritage doesn't want you to start thinking about that, so they leave out the percentage of total income earned by the top 1% and bottom 50%. (The top 1% earn about 24% of all income, up from about 9% in 1976.)
Here's another useful Citizens for Tax Justice chart that gives the relevant numbers for all taxes:

—Jonathan Schwarz
Posted at April 18, 2011 03:42 PMThis is not a case "fool me once or fool me twice." This is a case of their fooling "majority" of the people almost all the time and getting away with it........with their lies.
Such crookedness, beyond belief......
The willfully ignorant aren't being fooled. They're finding ways to sleep at night, and ceasing to shape their worldview short after.
Posted by: Amandasaurus at April 18, 2011 08:16 PM"Winning the Future" by paving a Royal Way to the Gilded Age past.
Posted by: AlcibiadesSlim at April 18, 2011 08:18 PMI had understood that the system had gotten significantly less progressive, but hadn't realized the extent to which we practically have a 'flat tax' of 30% now.
Instructive as this is, I'm kind of hoping there'll only words and non-math pictures in the next ATR post. Nothing more complicated than, say, the 'you are here' diagram.
Or a cute bear picture...
Posted by: Nell at April 18, 2011 09:02 PMNell, here's a video of baby penguin being tickled.
http://youtu.be/0GILA0rrR6w
Enjoy!
Posted by: Mike of Angle at April 18, 2011 11:15 PMClearly this inequitable distribution of the tax burden needs to be addressed by eliminating the death tax and taxes on capital gains.
Posted by: CDT at April 19, 2011 12:11 AMThat was one great penguin! ATR needed that.
So we have a flat tax. I can do it flatter. How about having the top 1% pay 2% of the taxes... and make 2% of the total income? (Why not 1%, you'll ask? Because I am NO COMMIE!)
Kudos for a very good post, Jon.
Here's another thing that nobody really ever thinks about any longer. We tax income, not wealth. So someone who has assets of 100 million dollars and has a paper net income (revenue - expense) of $100,000 pays the same income tax on that paltry-to-them sum as someone with no assets and credit card and other debt of 50,000 dollars with a net income of $100,000. Now, if you have no wealth, that's a scrape-by income for a family of four in a lot of places, but not really so much if you own 4 houses, a company, a plane, a big stock portfolio, and a few grand pianos. Focusing just oncome can be very misleading.
The upshot of this policy is that the ultra wealthy can have the same paper income and pay the same income tax as an indebted family of four unable to send their kids to college. Plus, we shouldn't assume that the $100 million in wealth isn't generating plenty of cash--it just has to generate paper losses too so that the taxable income is low, which certainly can be done. There's a reason GE could pay no corporate tax last year and still maintain a high stock value--it wasn't because they were going out of business.
Posted by: N E at April 19, 2011 11:58 AMObama said: "We are going to have to ask everybody to sacrifice. And if we're asking community colleges to sacrifice, if we're asking people who are going to see potentially fewer services in their neighborhoods to make a little sacrifice, then we can ask millionaires and billionaires to make a little sacrifice."
This is not just bad framing. It's revolting. Let me get this straight. The neighborhood kid who has to scratch her plans to take evening classes at the local community college, well, you see, that's just her doing her part in shared sacrifice. And having a hedge fund manager make $1b a year instead of $1.2b, well, that's sacrifice, too. We're talking real pain here. Because we all know what a HUGE sacrifice it is to get by on a mere $1 billion a year! In what twisted universe of Orwellian BS is this called "sacrifice"? Today that guy's tax rate is a cool 15%. Nice sacrifice if you can get it.
Can't wait for Obama's speech on crime. "Time for all of us to make a little sacrifice: if we're going to ask rape victims to complain less, then the least we can do is to ask rapists to make a little sacrifice, too, and cut down on the raping just a little."
I don't trust the "Citizens for Tax Justice" numbers either. I think they give tax % numbers that are too large for the rich and far too low for the workers.
Posted by: DavidByron at April 19, 2011 06:22 PMI object to the last graph, not because it fails to make the point you wanted to make, but because it is deceptive about income distributions. It suffers from the flaw of many poorly-designed histograms: unevenly sized bins. If we had evenly-sized bins on that graph, we would see that the top 1% has a share of income far in excess of everyone else. That the income distribution looks like an exponential distribution is neither necessary nor well-understood. The rich have far too much money in this country; flattening out the income distribution is good. Marginal utility of wealth increases as income decreases.
Posted by: saurabh at April 20, 2011 03:33 AM


