• • •
"Mike and Jon, Jon and Mike—I've known them both for years, and, clearly, one of them is very funny. As for the other: truly one of the great hangers-on of our time."—Steve Bodow, head writer, The Daily Show
•
"Who can really judge what's funny? If humor is a subjective medium, then can there be something that is really and truly hilarious? Me. This book."—Daniel Handler, author, Adverbs, and personal representative of Lemony Snicket
•
"The good news: I thought Our Kampf was consistently hilarious. The bad news: I’m the guy who wrote Monkeybone."—Sam Hamm, screenwriter, Batman, Batman Returns, and Homecoming
July 21, 2011
The Sherman and Mangano Study, Part 3
By: Aaron Datesman
To fully evaluate the finding of increased infant mortality in the Pacific Northwest due to the Fukushima disaster, it's useful to examine the report by Joseph Mangano upon which the Counterpunch announcement was based. There are a few pieces of information in this document which I wish had made it into the press release. For instance, while the article omitted this information, the report discusses the results of radiation monitoring performed by the Environmental Protection Agency:
After Fukushima, from March 22-25, samples of I-131 in precipitation at 12 U.S. sites had an average (median) level of 39.6 pCi/l, or about 20 times greater than normal. This figure was roughly half of 1) the peak level after Chernobyl and 2) after a large above-ground atomic bomb test by China in late September 1976.
(This highly math-y post is continued after the fold, because this is a family place.....)
Twenty times greater than normal is the average over the chosen subset of the monitoring stations in operation - it was much higher in many places on certain days. For instance, on March 27th, EPA measured a level of 390 pCi/l in Boise, ID. This is nearly 200 times greater than the average level. Since radioactive iodine in the atmosphere is deposited via precipitation (rainfall), in this situation it would not have been unreasonable to issue an advisory recommending that pregnant women and young children in Boise remain inside and avoid drinking tap water. This did not occur to my knowledge.
(This article by Gerald Pollet discusses fallout measured at other locations in the Pacific Northwest, along with EPA's decision to reduce the measurement intensity in their RadNet monitoring program.)
Mangano then tallies up infant deaths in those cities in the Pacific Northwest which are covered by the CDC mortality database, which is a sensible approach. (Due to the sparseness of the RadNet monitoring network, it's not an ideal approach. But it's reasonable.) His data is reproduced below.
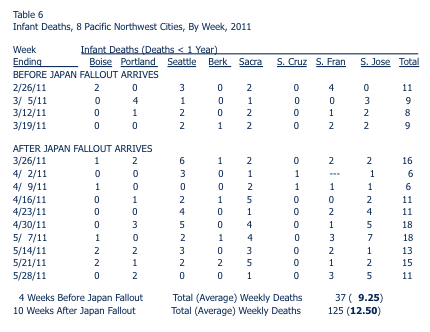
Eyeballing this data, there are only three locations where it seems possible that a post-Fukushima signal might be lurking: Seattle, Sacramento, and San Jose. Of course, these are also the largest population centers on the list, making the number of mortality incidents under examination in these cities larger than in Santa Cruz or Boise. For the sake of analysis, I chose to focus on the data for Sacramento, where the average number of mortality incidents in the four weeks before/ten weeks after the fallout from Fukushima arrived was 1.75/2.8. (That's a 60% increase.) A full, correct interpretation of the data in Table 6 would repeat the analysis I am about to demonstrate for Sacramento for each of the eight cities listed.
I downloaded the data myself from the CDC web site and compiled the two charts below, which cover about two and one half years of data. (The two charts contain identical information; the second chart just takes the data from the first chart and wraps it around every 52 weeks.) Fukushima occurred in the eleventh week of 2011.
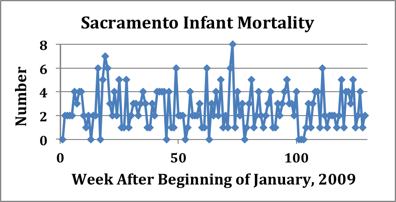
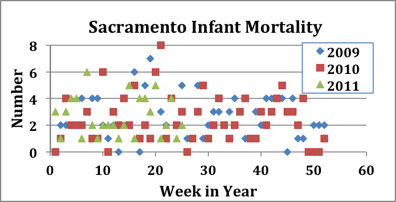
I think it's reasonable to say that there's no obvious signal present in the 2011 data for Sacramento after Week 11. In fact, over more than two years this data appears to have no very obvious structure or pattern, just random noise around an average level somewhere between 2 and 4 deaths per week. (Maybe there's a peak around Week 19, but it's far from clear - unless you already know the answer.) Utilizing this set of data and averages over intervals of five, ten, or some other number of weeks, then, it is obviously possible to get nearly any result by choice of interval. Sherman and Mangano, and their critics, are basically sitting in front of a TV tuned to static and arguing over whether they are watching "Miami Vice" or "I Love Lucy". This doesn't make any sense.
For the lay reader, I suspect this situation looks confused and impossible. For a certain flavor of electrical engineer, however, it looks like something else entirely: a homework assignment. This situation presents a rather basic problem in signal processing, which is a highly-developed technical field. It's a simple matter to utilize signal processing techniques to discover a clear structure to this data.
In order to discern the pattern, however, we have to consider why the raw infant mortality data looks so irregular and random. Shot noise is the principal culprit: nature has only integral units of one infant to utilize to create the mortality signal. If the "true" signal level is 3.2 per week, for instance, there is no way to create exactly that value for the signal in a given one-week interval. This is similar in its basic character to the noise statistics for small electrical currents and for small numbers of radioactive decays, which is a topic I have addressed before.
For radioactive decay in dilute systems of unstable nuclei (that is: low dose rates), we saw that the decay rate converged to a deterministic (as opposed to probabilistic, or random) value once we averaged together a large number of independent interaction volumes. (I have typically used the example of 40,000 decays/second of Potassium-40 in an average human body.) We can apply the same principle of averaging here, smoothing out the effect of shot noise by taking a moving average over two or more weeks. This is pretty intuitive, I think. While it seems basically reasonable and sensible, experts gin it up by calling it "Finite Impulse Response" filtering.
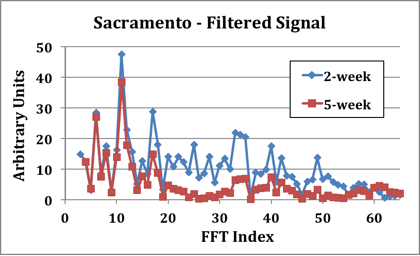
Whatever it's called, the result of applying a two-week moving average to the Sacramento infant mortality data from 2009 and 2010 is shown below. The filtered data show a clear peak around Week 20, and what may be a second peak around Week 44. The peak rate of infant mortality is clearly around twice the average rate, which indicates that it's completely impossible to analyze the CDC data without first working out how the infant mortality signal varies with time.
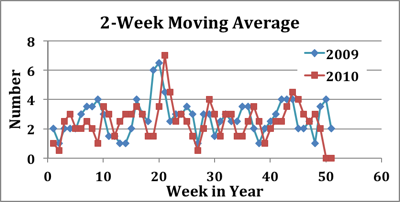
No analysis which fails to work out the temporal (that is: with time) infant mortality signal can be considered correct. Since I hope someone will continue to monitor the rate of infant mortality in areas affected by fallout from Fukushima, this will be something to keep in mind when examining the validity of future claims and counter-claims.
The graph I published in this post used five-week moving averages and compared the 2011 signal to the average of the signals from the previous two years. While the signal shifts by a few weeks from year-to-year (as, indeed, the weather often does), it's very evident that the trend in infant mortality in 2011 hews rather closely to its recent historical behavior.
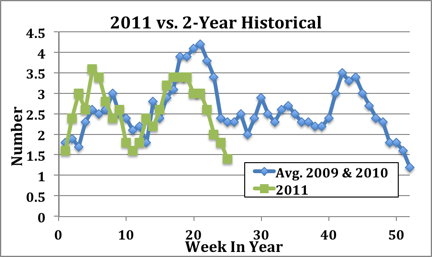
This is the basis of my contention that Sherman and Mangano got punked by Mother Nature. The fallout from Fukushima arrived precisely at the trough in the 2011 signal around Week 11 (in Sacramento, at least), after which the infant mortality rate followed its historical pattern and doubled in the weeks following. This is increase is not obviously correlated to Fukushima at all.
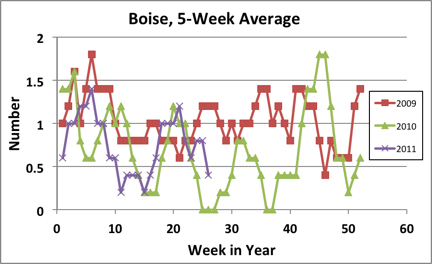
The one additional place it would make the most sense to look is the location with the highest recorded level of fallout - Boise. The results of this analysis are shown below. Because the population is much smaller, in this case the signal is much less clear. However, the 2011 trend in infant mortality does appear to follow the signal from 2010, and there is no discernible increase above trend following Week 11 which might correlate to Fukushima fallout.
A full evaluation would perform the analysis I've done for Sacramento and Boise for each of the other six cities for which there is CDC infant mortality data. I won't be doing this now, but I think it would be interesting to return to it in early 2012 - a full nine months after the possible exposure of a first-trimester fetus to Fukushima fallout.
BONUS FOR MATHY FOLKS:
For most classes of signal (a signal being a measurement of interest monitored either continuously, or at discrete intervals), there are two sorts of questions we can ask. The first relates to time: what is the level of the signal on this day or at that time? The second answers the question, how often? In scientific/technical terms, the second variety of questions relate to frequency. These two means of analyzing the information encoded by the signal are equivalent. We can discuss either the time signal, or what is called the frequency "spectrum", interchangeably.
The infant mortality "signal" is a digital signal; it consists of discrete integral values at consistent time intervals. Therefore, the proper means of evaluating the frequency spectrum of the signal (answering questions such as, "How often is the level of infant mortality equal to 6/week?") utilizes a mathematical construct known as the Discrete Fourier Transform (DFT). In practice, the DFT is implemented using an algorithm called the Fast Fourier Transform (FFT). This is not a very arcane piece of knowledge - Excel possesses an FFT capability. The graph below shows the FFT of the raw infant mortality data from Sacramento I generated using Excel.
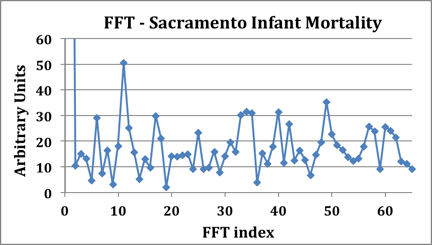
This is a rather noisy signal, but it does possess a clear peak at an FFT index of 11. The high-frequency components are no surprise, since shot noise contributes a white spectrum (equal noise power in each unit of bandwidth) to the signal. Considering the frequency spectrum, then, the proper approach is obvious: we should apply a low-pass filter to the signal in order to "clean it up". This is precisely the function of the moving average, as shown in the graph below exhibiting FFTs of the infant mortality signal for 2-Week and 5-Week moving averages. You can see that increasing the degree of filtering by extending the averaging interval suppresses the higher-frequency components of the signal.
The point to these three posts, I guess, is this: when evaluating health statistics, it's necessary to ask "What's the frequency spectrum of the signal?" If there's no answer to this question, you shouldn't believe the researcher's conclusions without further evaluation.
(As I should not have done with the Sherman/Mangano study. They were not the only ones who got punked by Mother Nature in this instance.)
— Aaron Datesman
Well, I know this. My hair stopped growing recently, so blaming it on nuclear pollution strikes me as just fine....that or the fact that I am somewhat north of 60. OTOH I can now stiff my barber, shift haircut resources, and modulate my indifference curves.
mmmmmmm, mmmmm.....neener, neener....My income line is now tangential to a preference for 1/400,000,000 more of a luxury yacht vs. refried beans. I am so happy.
Posted by: bobbyp at July 22, 2011 12:01 AMNow I remember why I never wanted to become an electrical engineer!
That's really hard material for me, but let's be clear: A lot of science isn't this difficult, and many scientists will avoid using their expertise to reach obvious conclusions they don't like, or alternatively misuse their expertise to reach bogus conclusions. They will do this for money, for professional advancement, for ideology, to avoid personal discomfort, for patriotic reasons, or even, perhaps especially, to avoid being mocked. It's tiresome. With enough money, it's not hard to find a Nobel winner who will say any damn thing.
I can forgive the not doing homework, but lobotomzing oneself for any or all of the above reasons, that's pathetic. A whole bunch of scientists need to quit being so full of themselves or so damn greedy and/or just grow a pair and cut that out. You hear that, ya'll!
Not my scientific guru Aaron though. Way to go Aaron!
Posted by: N E at July 23, 2011 07:28 AM@NE -
Thanks for the compliment; I appreciate it very much, though I don't wish to be anybody's guru.
I agree with the comments about scientists and Nobel prize winners. Someday I will find a critic of the Yablokov report to ask what the difference is between scientific "peer review" and middle school "peer pressure". It remains a bit of a mystery to me.
I should have worked harder to make a basic point, however: this is quite basic science. All I did was look at the data using a two-week moving average, rather than examining the weekly numbers.
This is scarcely mysterious - it's no different than a moving stock average. I believe this reinforces your point that scientists should open up their minds and fulfill their societal obligation to act as critics.
The stuff about DFT's and shot noise etc. I added on later. This is not layman-accessible, but it should be comprehensible to any smart physics undergraduate, and familiar to electrical engineering undergraduates in the communications sub-field at the junior or senior level.
There are many hundreds of thousands of Americans with this level of knowledge. So it's a tragedy to witness the horrible information and judgments we receive.
Posted by: Aaron Datesman at July 24, 2011 12:17 PMaaron datesman would require proof that the sky is blue and the sun yellow while standing outside on a sunny bluebird day with his color-accurate vision intact... he'd need charts graphs and statistics else he would not believe.
Posted by: Karl at July 24, 2011 04:29 PMAaron Datesman: Now that YOU mention it, moving averages makes sense. Variable dosage from minute to minute and varying rate of decay among the different particles.
Posted by: Mike Meyer at July 24, 2011 05:24 PMFunny, it's stuff exactly like this that makes me want to be an engineer.
Posted by: Amandasaurus at July 24, 2011 10:21 PM@Karl - Well, since the sky is transparent and the sun is white, you've picked interesting examples... Actually, my deal isn't with needing data, so much as with interpreting the data we have intelligently.
@MM - Yeah, I realize now that there's a theme here. Sometimes we're told to look at the average (for instance, the whole-body dose), when the effect (cancer) relates to the instantaneous rate - which may be far higher in a limited subset. In this case, it's the opposite: we can resolve a picture which can't be seen in the instantaneous data by looking at the average rate.
This is a problem that the Greeks first wrestled with 2500 years ago; it was solved completely by Newton and Leibniz. Apparently in the intervening 350 years their knowledge still hasn't spread very far.
@Amandasaurus - Funny, it's stuff like this which makes me ashamed to be an engineer. It often occurs to me that, if just 50,000 good engineers grew a social conscience and refused to work for death, the entire edifice of our military dominance would begin to crumble. If that happened, I think our relationships with the rest of the world would quickly assume a more healthy character.
Posted by: Aaron Datesman at July 26, 2011 02:02 PM...which is why I wish to become one. Initiating change isn't limited to holding up a handmade sign and shouting about things.
Posted by: Amandasaurus at July 26, 2011 02:55 PM


