April 16, 2013
We Ream Them As Best We Can
It's almost always bogus when newspapers like the Washington Post give government officials anonymity, but this is certainly a legitimate use of it:
The Pentagon is deepening its military involvement across Africa as it confronts an expanding array of terrorist movements and guerrilla groups. In doing so, the U.S. government has become dependent on several countries with checkered democratic records. That in turn has lessened Washington’s leverage to push those countries to practice free elections and the rule of law...“The countries that cooperate with us get at least a free pass,” acknowledged a senior U.S. official who specializes in Africa but spoke on condition of anonymity to avoid retribution. “Whereas other countries that don’t cooperate, we ream them as best we can.”
The official said the administration of former president George W. Bush took the same approach in Africa. Many U.S. diplomats and human-rights groups had hoped Obama would shift his emphasis in Africa from security to democracy, but that has not happened, the official added.
“There’s pretty much been no change at all,” the official said. “In the end, it was an almost seamless transition from Bush to Obama.”
—Jon Schwarz
April 14, 2013
Bill Clinton to Condoleezza Rice in 2003: Invading Iraq Would Be Morally Right Thing to Do
Last week Glenn Greenwald interviewed Flynt and Hillary Mann Leverett, who both were National Security Council staffers during the Bush administration. At one point Hillary Leverett describes how "the entire American political apparatus," including Bill Clinton, supported the invasion of Iraq:
LEVERETT: It wasn't just ideologically-driven people, individual actors within the Bush administration, that were driving us to war. It was the entire American political apparatus. In a lot of ways, we thought, it was essentially tough to have checks and balances, to ask hard questions, when the United States was pursuing policies that could end up killing a lot of people and really do serious harm to our interests.We saw the Bush administration, of course, make very bad decisions, but even more disheartening for us, even more disturbing to us as professional political analysts and policy-makers, was the opposition, the Democrats. We remember when Condi Rice came back from going to meet with – she was my boss at the time – going to meet with Bill Clinton, and she recounting how he put his arm around her, and told her that what the Bush administration was doing in gearing up for this invasion of Iraq, was not just the correct thing to do strategically but it was the morally right thing to do.
This was from the leader of the Democratic opposition, in a sense. The leading Democratic senators in Congress, the media, they were all not just supporting it, but hyping information that we didn't see – to read in the New York Times that there was this case of weapons of mass destruction in Iraq, that we didn't see with our top secret security clearances in the White House, was a really jarring experience on the negative side.
This isn't the first time Leverett has said this about Clinton and Iraq. In 2007, when Bill Clinton was campaigning for Hillary, he claimed he had "opposed Iraq from the beginning," which irritated Leverett so much she spoke to the Washington Post about it:
Hillary Mann Leverett, at the time the White House director of Persian Gulf affairs, said that Rice and Elliott Abrams, then National Security Council senior director for Near East and North African affairs, met with Clinton several times in the months before the March 2003 invasion to answer any questions he might have. She said she was "shocked" and "astonished" by Clinton's remarks this week, made to voters in Iowa, because she has distinct memories of Abrams "coming back from those meetings literally glowing and boasting that 'we have Clinton's support.' "...She recalled being told that Clinton made it clear to Rice and Abrams that they could count on his public support for the war if it was necessary.
And Clinton didn't just support the invasion of Iraq privately; as Fairness and Accuracy in Reporting pointed out in 2007, he supported it publicly too. The day before the war started he wrote an op-ed for the Guardian headlined "Trust Tony's Judgement." And in 2004 he told Time Magazine "I supported the Iraq thing."
P.S. In a recent slam of Oliver Stone and Peter Kuznick's book and TV series The Untold History of the United States, Princeton historian Sean Wilentz sneered at them for portraying "liberal anticommunism [after World War II] as virtually indistinguishable from – indeed, as complicit with – the anticommunism of the right." After all, if Untold History convinced viewers that was true, they might also begin to believe something even nuttier, like that liberal foreign policy today is virtually indistinguishable from conservative foreign policy. Wilentz is good friends with Bill Clinton, and they probably spend lots of time together shaking their heads sadly about people crazy enough to think that.
—Jon Schwarz
April 08, 2013
Thanks, Blood and Iron Lady
A few people may still remember that Margaret Thatcher (who in 1981 privately wrote she was "very pleased" to sell as many British weapons as possible to Iraq) played a key role in the first Gulf War:
Thatcher Reminds Bush: 'Don't Go Wobbly'
On Aug. 2, 1990, the morning after Iraq occupied Kuwait, Mr. Bush told reporters: "We're not contemplating intervention. I'm not contemplating such action.Then he flew to Aspen, Colo.
There he met Margaret Thatcher, the British Prime Minister. They talked for hours.
That afternoon, at a joint press conference, Mr. Bush condemned "naked aggression" and said he was considering "the next steps needed to end the invasion."
But what essentially no one remembers today is that, in a weird way, Thatcher also played a key role in the Second Gulf War:
According to [favored Bush family biographer Mickey] Herskowitz, George W. Bush's beliefs on Iraq were based in part on a notion dating back to the Reagan White House - ascribed in part to now-vice president Dick Cheney, Chairman of the House Republican Policy Committee under Reagan. "Start a small war. Pick a country where there is justification you can jump on, go ahead and invade."Bush's circle of pre-election advisers had a fixation on the political capital that British Prime Minister Margaret Thatcher collected from the Falklands War. Said Herskowitz: "They were just absolutely blown away, just enthralled by the scenes of the troops coming back, of the boats, people throwing flowers at [Thatcher] and her getting these standing ovations in Parliament and making these magnificent speeches."
Beyond that, Thatcher also directly called for the invasion of Iraq in a July 17, 2002 Wall Street Journal op-ed:
Don't Go WobblySaddam must go...It is clear to anyone willing to face reality that the only reason Saddam took the risk of refusing to submit his activities to U.N. inspectors was that he is exerting every muscle to build WMD.
—Jon Schwarz
April 07, 2013
Not Johnny's Theorem
By: Aaron Datesman
I have my Geiger counter on, sitting on the desk next to me. The number it displays varies a little but remains around "0.14". (Since it's from Ukraine, I'm unsure what the units should be. It might be microSieverts per hour, but I don't read Cyrillic very well.) It beeps in an interesting non-pattern: not frequently, occasionally with a few beeps spaced pretty close together, then sometimes silent for a long while. It's perfectly distracting, actually, so I think I'll turn it off.
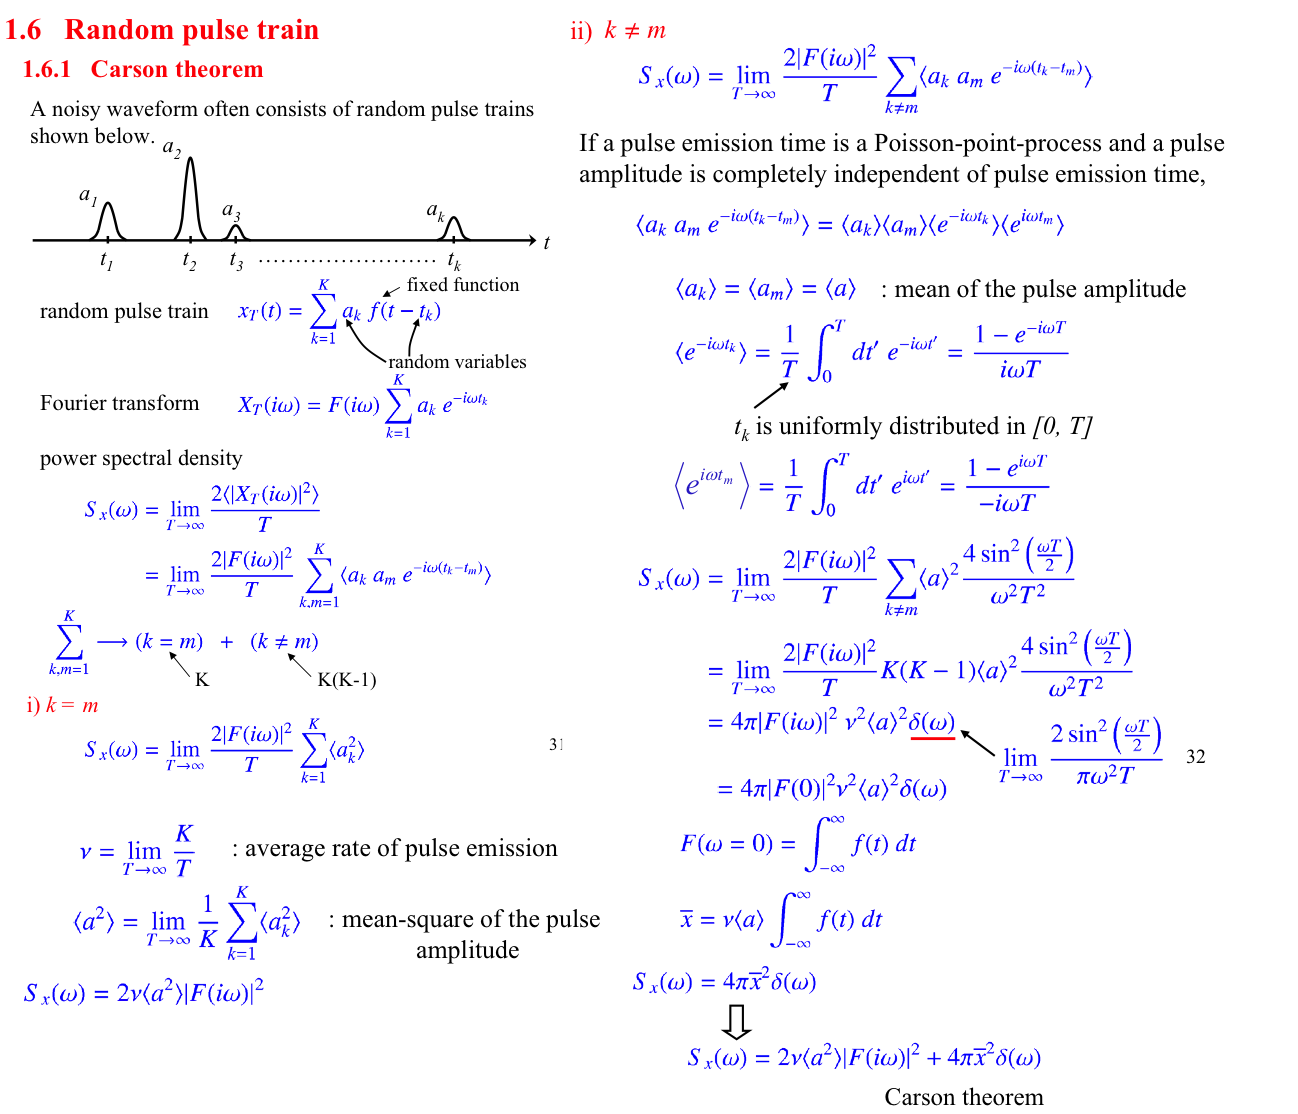
In physics class, they'll teach you that the spacing of the beeps is perfectly random, that there is no underlying pattern or structure of frequency. Engineers think of the string of beeps as a signal, calling a signal of this type "white noise". Professor Y. Yamamoto of Stanford, who in 2011 taught a course titled "Fundamentals of Noise Processes", no doubt is such an engineer. After the fold I have reproduced a couple of pages from the notes to his course, available on the web here.
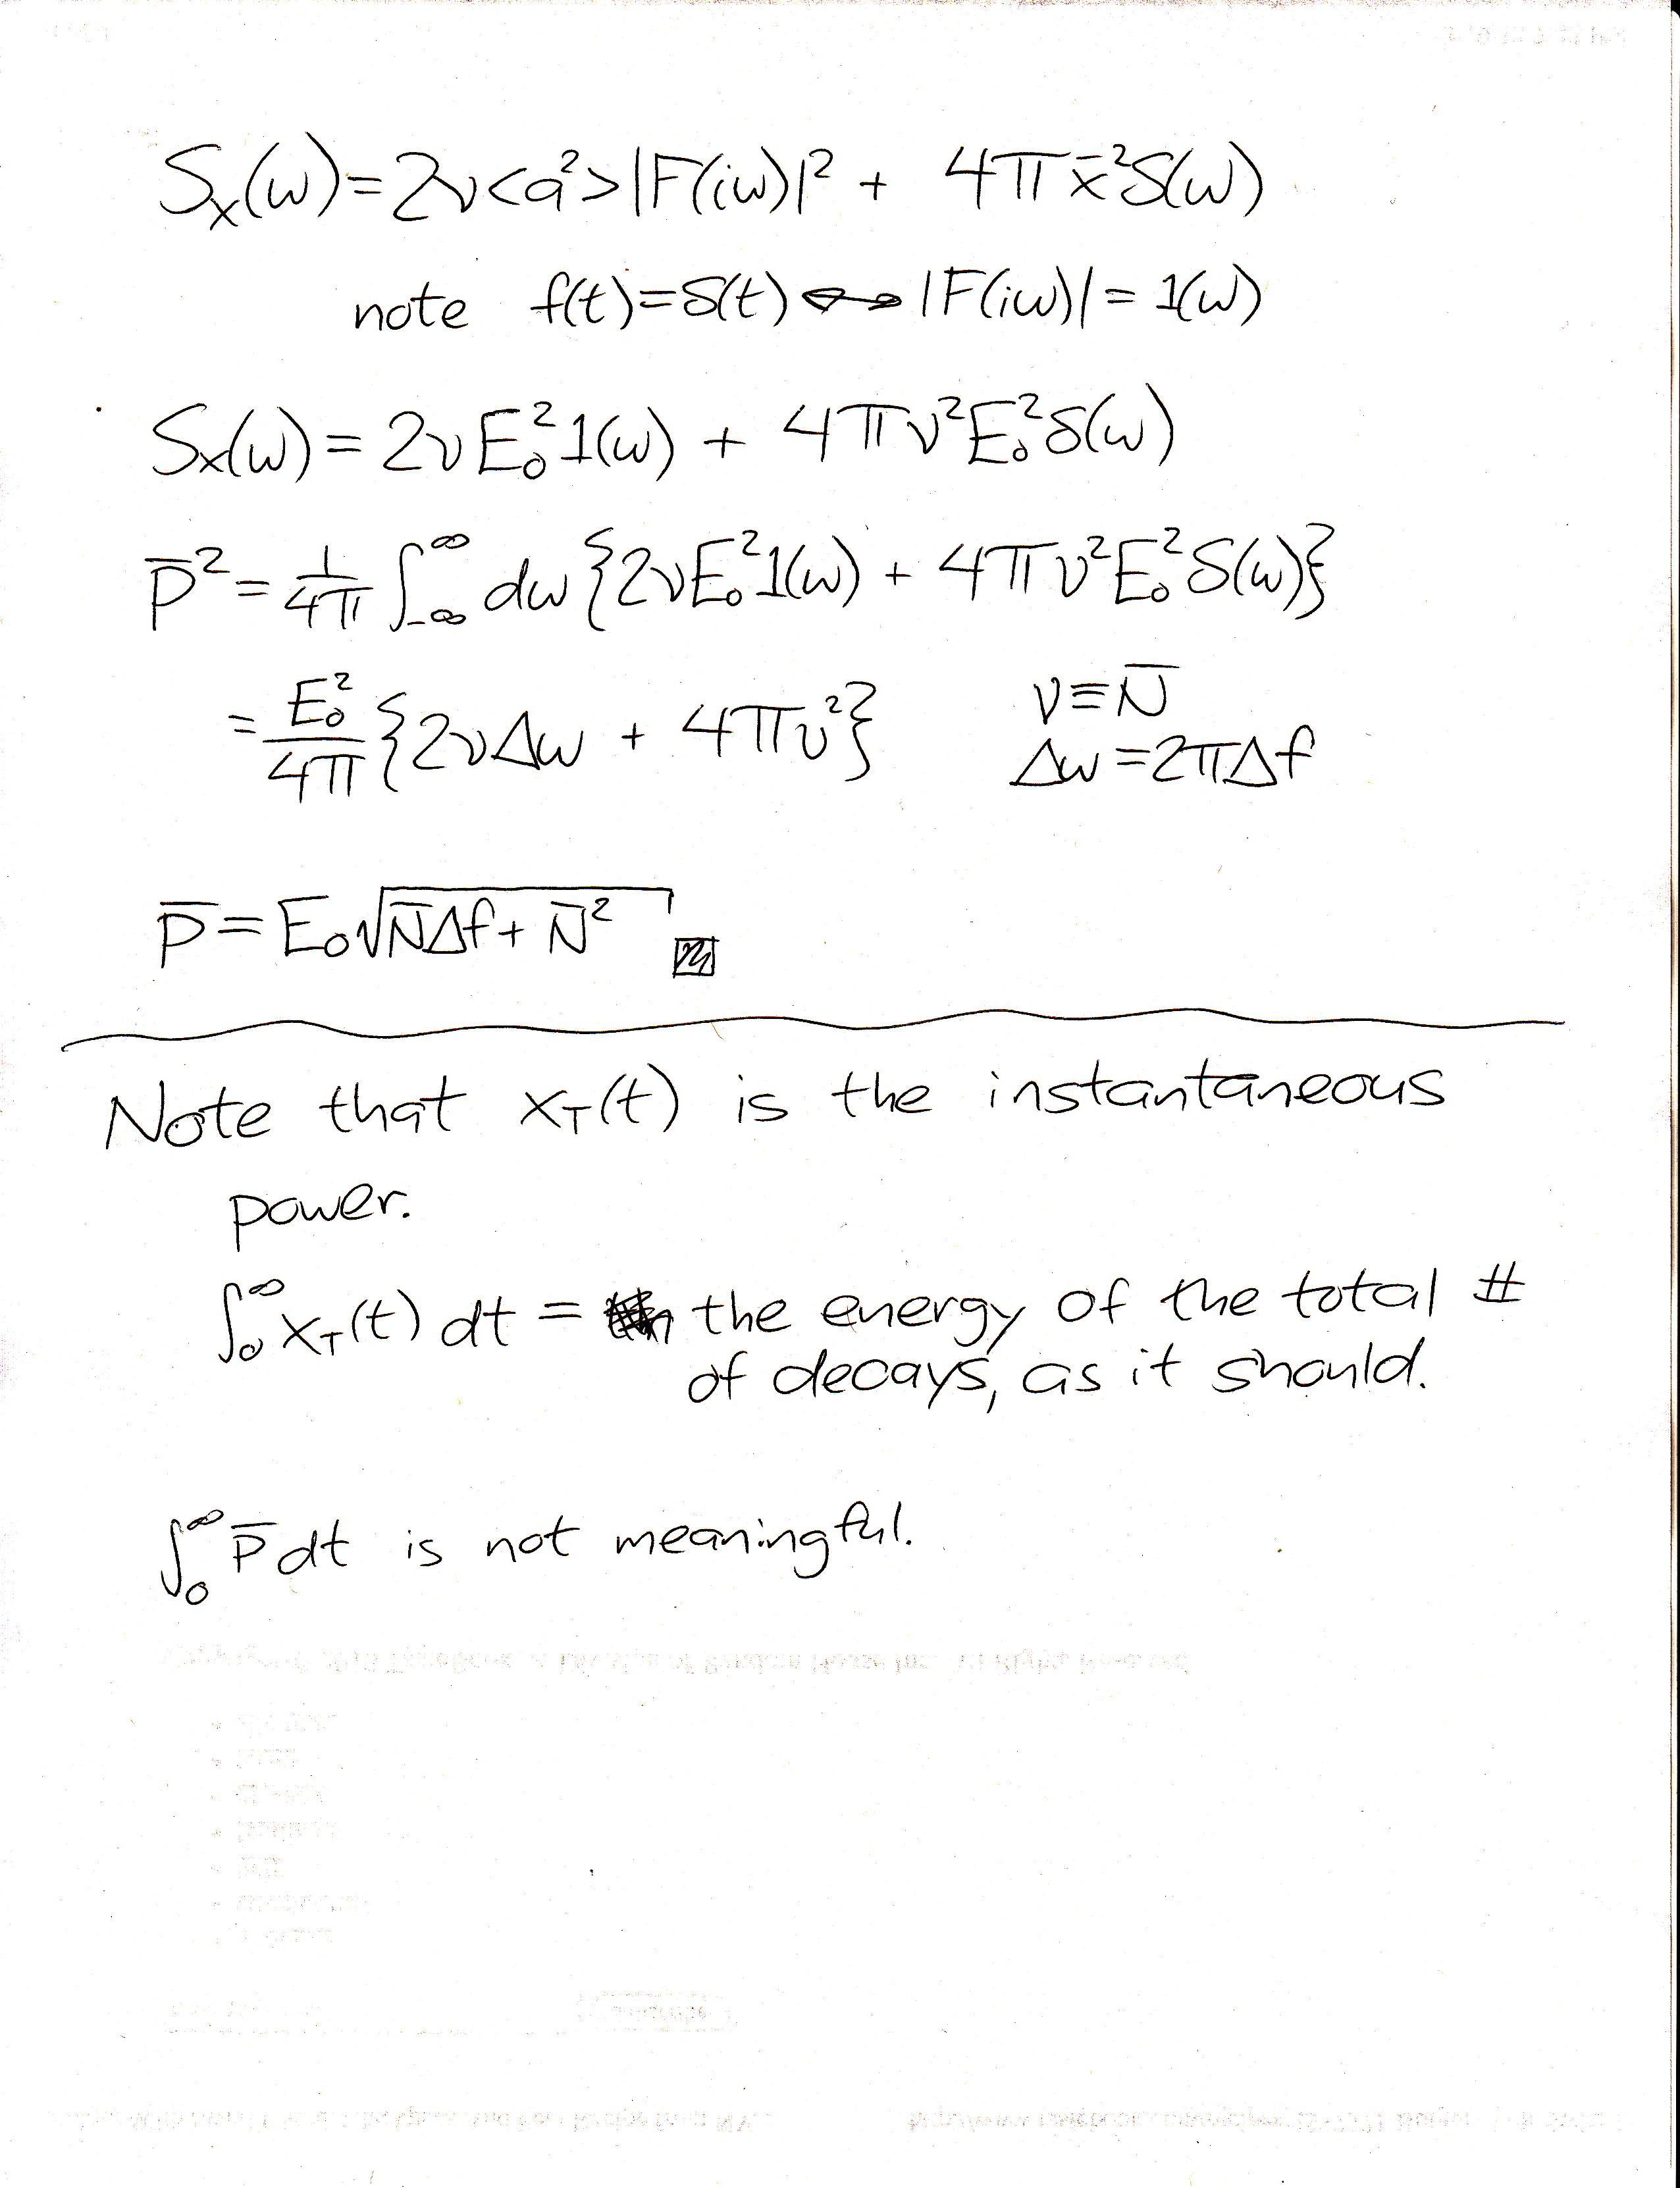
The first figure shows the derivation of a result known as Carson's Theorem, which is a generalized version of Schottky's result for shot noise in electrical circuits. The second figure, in my handwriting, shows the few steps required to apply Carson's Theorem to find the decay power generated by a dilute system of radioactive contaminants.
The result is not difficult to obtain. I feel reasonably certain that the NRC, DOE, IAEA, National Academy of Sciences, US government or a neighborhood troop of Girl Scouts could have figured this out if they had just asked somebody.
— Aaron Datesman
* Readers with a bit of technical education will note that this result is easy to derive because all that's required is the substitution E->q. This changes the random pulse train from representing current, i(t), to power, P(t). The energy delivered via radioactive decay is the integral of P(t), which correctly yields the number of decays times the energy of one decay E.
The power in a random signal is not immediately calculable from P(t), which after all is perfectly random and cannot be known. The treatment outlined in the derivation of Carson's Theorem must be utilized instead. Because the linear dose model does not employ this widely-known (within the engineering and physics communities, at least) and fundamental knowledge, the linear dose model is incorrect.
Lastly, the chemical state of the interaction volume is directly related to the power because of the conservation of energy. When an unstable nucleus decays, the energy released has nowhere to go except to be stored in the chemical potential of broken bonds. So that's where the decay power goes, immediately, without delay.
April 06, 2013
Saturday Night Graphs
By: Aaron Datesman
An early commenter to this post made the intelligent suggestion that a graph showing the prediction of the linear dose model would have been helpful. I agree! Here's that graph:
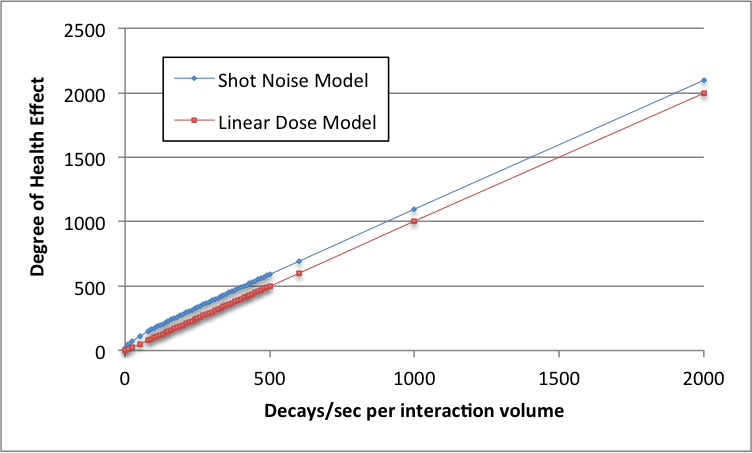
The two curves never truly converge (due to shot noise, there is always an excess equal to half the frequency bandwidth), but they're not significantly different. This indicates that the decay power (determined by the shot noise model) and energy (the fundamental quantity described by dose) are numerically identical. In sum: the linear dose model basically works in this domain.
So, let's extrapolate downward to low doses:
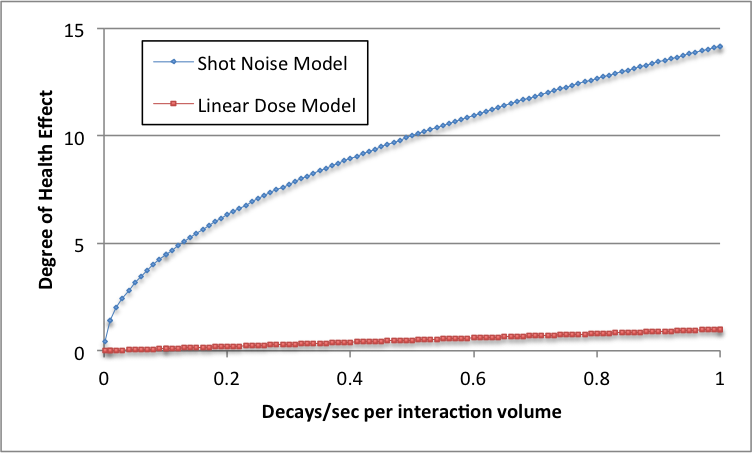
For low decay rates such that the chemical state of the cell is disturbed only about 1% of the time, the linear dose model misses by a factor of around 10. For even lower decay rates (since the square root of N is much bigger than N if N<<1), the relative situation is much worse.
Hm.
— Aaron Datesman
April 04, 2013
A Fluctuating Gift
By: Aaron Datesman
Hey, I like you, and I want to give you a gift! (Well, there's a catch - but I'm like that.) Are you excited? Here it is: a cubic meter of air! You can't live without it. Isn't it great?
You won't mind the catch at all, it's totally a small thing. I'll even tell you the answer. The density of this cubic meter of air is 1.225 kilograms per cubic meter. Easy, right? Next year, I'm going to call you up, and I'm going to ask you to do a simple thing. I'm going to ask you to look carefully at one-tenth of your volume of air, and tell me what its density is.
The following year, I'm going to ask you the density of a one-tenth portion of that 1/10th. And so on, until you get tired of me and give the air back. But you need air, right? That's right! And I need somebody to talk to, so, I think we're good here. Right?
In 2014, the density of any 0.1 cubic meter portion of my air is 1.225 kg/m^3.
In 2015, the density of a 0.01 cubic meter portion of that 0.1 cubic meter of my air is 1.225 kg/m^3.
In 2016, the density of a 0.001 cubic meter portion of that 0.01 cubic meter portion of that 0.1 cubic meter sample is 1.225 kg/m^3.
In 2017, the density of a 0.0001 cubic meter portion of that 0.001 cubic meter portion of that 0.01 cubic meter portion of that 0.1 cubic meter sample is - wait for it! - 1.225 kg/m^3.
I won't further belabor the point. Against a downward extrapolation of volume, the density of a sample of air is constant. Or: is it?
Actually, it's not: density is a statistical quantity. The motion of air molecules is random, and fluctuations in their distribution within a volume do continually occur. (Trivial example from elementary thermodynamics: if you have eight air molecules in a box, the chance that they all wind up in the left half of the box is (1/2)^8, or 1 in 256. The density of the air on the right side in that instant of time is zero.)
After some number of years, I have grown tired of this fruitless annual exercise in air monitoring, so when my friend calls I glance at the new sample only very quickly before replying, "The density is 1.227 kg/m^3". If you look at a small volume for only a short time, you are likely to catch a fluctuation due to the random motion of air molecules. (As an engineer, I convert the small time of observation to a "frequency bandwidth". This simply measures how fast my eyes are.)
The density of a large sample, or of a small sample observed for a long period of time, will be 1.225 kg/m^3. But the choice of large volume or long observation time (equivalent to a small bandwidth) has an averaging effect. Fluctuations in the density are always present if one is able to look closely and quickly.
Does this matter? Well, consider: around 2031, the sample of air I'm asked to examine has a volume of about 1 cubic micrometer. Fluctuations in the density of air on scales a bit smaller than this are the reason the sky is blue.
Proper scale is the reason the shot noise model described in the previous post is correct: it relates the health outcome to the chemical state that exists in biologically relevant volumes (about 1 cubic millimeter) over biologically relevant time scales (about 5 milliseconds, with some caveats). The linear dose model, on the other hand, washes out meaningful fluctuations in the chemical state of biological tissue by improper averaging.
Very often THE FLUCTUATION IS THE PHYSICS. (I believe this because it's especially true in the field of superconductivity, where I have spent most of my scientific career.) The analogy with the color of the sky is exact.
I comprehend the resistance to the idea I have presented. Nevertheless, it is quite correct.
— Aaron Datesman
April 02, 2013
Sure, This One Goes To 11; But Can You Turn It Down To 0.11?
By: Aaron Datesman
I've previously written that our regulatory standards for exposure to low doses of ionizing radiation are based upon extrapolations downward from high doses. The framework is called the "linear dose model". You could say that I'm not fond of it. Perhaps my fundamental complaint (among the very many there are to choose from) is that the regulatory and scientific advisory bodies that utilize this model seem willfully blind to the idea that a "model" is a guess, rather than a law.
Since the linear dose model in reality is a guess, for its predictions to be credible it is absolutely necessary continually to audit the model to verify its accuracy. In the world we inhabit, unfortunately, this does not ordinarily happen. Instead, government and industry point to the predictions of the linear dose model to argue against any possibility of harm, forestalling meaningful audits of the model's validity. The circularity of the logic is perfect.
Nevertheless, the 1979 disaster at Three Mile Island was severe enough that a meaningful audit (albeit incomplete and not comprehensive) was actually performed. The data uncovered by that audit demonstrate convincingly that, for at least one type of exposure to ionizing radiation and one deleterious health outcome, the linear dose model is incontrovertibly incorrect.
In 1997, Steve Wing at the University of North Carolina - Chapel Hill published a reanalysis of health effects due to the Three Mile Island nuclear disaster, covering just the population in a ten-mile radius around the plant through the year 1985. The article, "A Reevaluation of Cancer Incidence Near the Three Mile Island Nuclear Plant: The Collision of Evidence and Assumptions", appeared in Environmental Health Perspectives - a peer-reviewed, open-access journal supported by the National Institutes of Health. The table below is lifted from his paper:
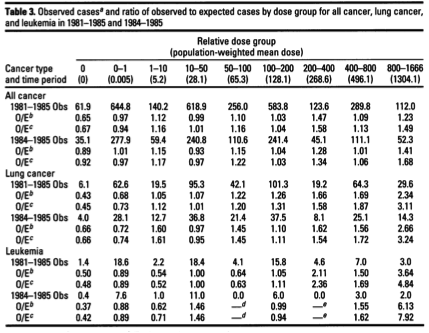
"O/E" indicates the ratio of Observed to Expected incidence of (not mortality from) cancer. If the doses were small and the exposures generally "safe", then one would expect to see values of O/E near one and no clear trend of increasing incidence with dose. This is sort of the story I see for "All cancer", the first section in the table* - at least, there's no clear dose response. It is important to point out, however, that this study ends in 1985. Since most forms of cancer have a longer latency than six years after exposure, this null result indicates only that the study didn't run long enough to demonstrate or rule out harm in this category.
The leukemia data is more substantive, but the truly interesting information relates to lung cancer, in which a clear dose relationship is evident. Joe Mangano of the Radiation and Public Health Project pointed this out in a letter to Environmental Health Perspectives; I wrote about it here.
Mangano ascribes the non-linear dose relationship to the "Petkau Effect", and claims that the mathematical relationship is logarithmic. The Petkau effect is a real (and very interesting) phenomenon in radiation biology, and I'm sympathetic to the idea that the dose response could be logarithmic in some situations. However, I'm unsure how the two concepts fit together. (Perhaps that information is contained in the original article by Petkau, which I have been unable to locate.)
In any event, the idea that the dose response might be logarithmic resonated for me. I thought about it a lot, and wrote quite a bit about it in April 2011, starting about here. For one thing, the idea that effects at high doses can be linearly extrapolated down to low doses is clearly nonsense. The linear extrapolation violates a basic teaching from statistical mechanics: the variance of a statistical quantity increases as its numerical value decreases. It irks me that the radiation health physics community apparently is exempt from this basic understanding, while I was required to grasp this idea in order to pass Physics 430 when I was twenty years old.
I set about learning what statistical mechanics might have to say about the possibility of a logarithmic dose response, and began to uncover relationships that seem to replicate the relationship that Mangano posited (posted here, for instance). But after a time I understood that I had approached the problem inelegantly (this is physics-speak for, "I wuz dumb,") and had conflated two separate phenomena in my head. The increasing variance in the decay rate is one; the other one is shot noise.**
The theory of shot noise was fully worked out by Walter Schottky around 1920. Schottky developed this theory to describe the operation of vacuum tubes. It turns out not to be possible to turn a tube amplifier down from "LOUD" to "quiet" (a linear extrapolation of volume downward) because electrons come in discrete packets that cannot be divided. Shot noise creeps in to destroy the performance of the amplifier on its most quiet settings.
Radioactive decays likewise come in discrete packets that cannot be divided. On this fundamental basis alone, the linear dose model cannot be correct. For instance, it's absolutely meaningless to consider the biological effect of 0.11 decays of an atom of radiostrontium adhered to your femur bone. But the linear dose model utilizes precisely this sort of understanding.
Many professors of electrical engineering, physics, or astronomy can, no doubt for a generous consulting fee, write down Schottky's equation from memory and then carry on with their business after shooing you away. This is the result*** for the average decay power (including the shot noise contribution) generated by a dilute system of radioactive particles. The total derivation in my notes takes up about seven lines and only barely requires calculus:
![]()
Among other situations, this equation would apply to a lungful of radioactive krypton or xenon gas expelled from the damaged reactor at Three Mile Island in Middletown, Pennsylvania, in 1979. The expression is fit**** to Wing's TMI lung cancer data in the graph below.
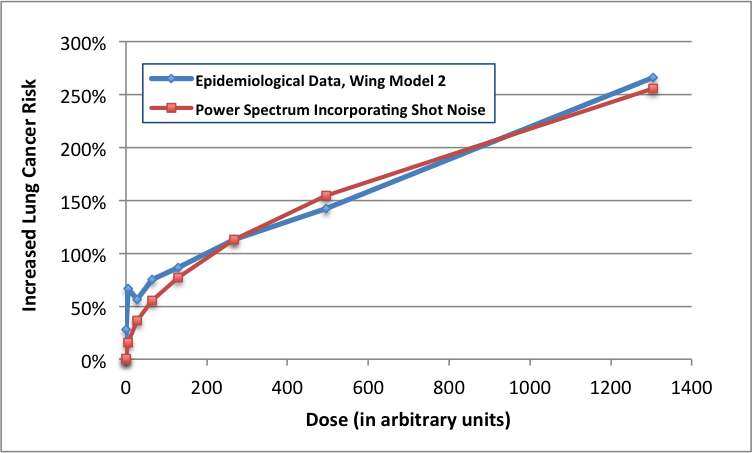
While it is impossible to prove a rule no matter how many supporting examples you acquire, all that's required to disprove a rule is one contrary example. The graph above - the result of an immoral experiment performed on innocent American citizens in March, 1979 - is the strongest possible counter-example to the linear dose model.
I don't believe the linear dose model, or any of the assessments of safety based upon it, because it's self-evidently contrary to the basic laws of physics and to the best available epidemiological evidence. The dial for radioactive decays and exposure goes up to 11, and even to 111 and beyond. But it doesn't have a setting smaller than one. Since this is true, the linear dose model cannot be correct - and it demonstrably is not.
So, understand this: when someone with authority explains that radiation is not very harmful and that only a very few people will suffer from the Fukushima disaster (or did suffer from Chernobyl, or TMI, or even from routine emissions generated by operating nuclear power plants), their judgment rests upon a thin veneer of science covering a steaming pile of horseshit. The scientific community has known the correct theory describing the shot noise power spectrum for nearly a century. That this knowledge has so far failed to penetrate the radiation health physics community is an astonishing scandal.
— Aaron Datesman
*Actually, in the higher-dose cohorts the cancer incidence seems to be 20% - 50% above the average, which is quite significant. But there's a wrinkle involving how the data are presented, so it's actually worse than that. For some reason, Wing chose to compare the cancer incidence in individual dose groups to the average incidence among the exposed population. (This is how O/E ratios below one at zero dose are obtained.) Perhaps this is standard in epidemiology - I have no idea - but if I had written the paper I would have compared the incidence in an individual dose group to the incidence in the group with zero dose. That comparison reveals an increase of cancer incidence in the high-dose group greater than 100% - that is, more than double.
** I imagine that these are related, actually. But that's a very mathematical tangent to the overall story that isn't very important.
*** Technical note: P is the instantaneous power dissipated through radioactive decay; this quantity is directly related to the density of free radicals generated by ionization events in the interaction volume, and thereby to the local chemical perturbation and to the health effect. E is the energy deposited in the interaction volume by a single decay, N is the average rate of decay within a single interaction volume, and Δf is the bandwidth of the biological response. This bandwidth is the inverse of the time required for the biological volume to return to its chemical equilibrium, which is on the order of 5 milliseconds. [1] There is experimental evidence supporting an interaction volume of approximately 1 cubic millimeter in size. [2]
Note also that the expression collapses to the linear dose model for large decay rates. When the decay rate in an individual interaction volume is small, however, the chemical response follows a square-root dependence. This shot noise contribution is much (for very dilute contamination, hundreds or even thousands of times) larger than the linear dose model predicts.
[1] Spitz et al., "Metabolic oxidation/reduction reactions and cellular responses to ionizing radiation: A unifying concept in stress response biology," Cancer and Metastasis Reviews, vol. 23, pp. 311-22, 2004.
[2] Belyakov et al., "Biological effects in unirradiated human tissue induced by radiation damage up to 1 mm away," Proceedings of the National Academy of Sciences, vol. 102, no. 40, pp. 14203-8.
**** This is a good fit; I made no effort to find the optimal fit, since the shape of the curve is the principal takeaway. (If it's a curve, then the linear model isn't valid.) However, the theory doesn't quite fit the very steep rise at very low doses. The divergence could simply reflect uncertainty and the effects of averaging within a dose group. It could also arise because the actual doses on the low end were higher than estimated. This seems plausible because the lowest doses would be the most difficult to estimate accurately.
As an added wrinkle, though, the little dip in the curve makes me wonder whether this is an example of the "biphasic" (or non-monotonic) dose response investigated by Professor Elena Burlakova of the Russian Academy of Sciences. That is too large a conjecture to hang on a single data point, however.


